目錄
Introduction
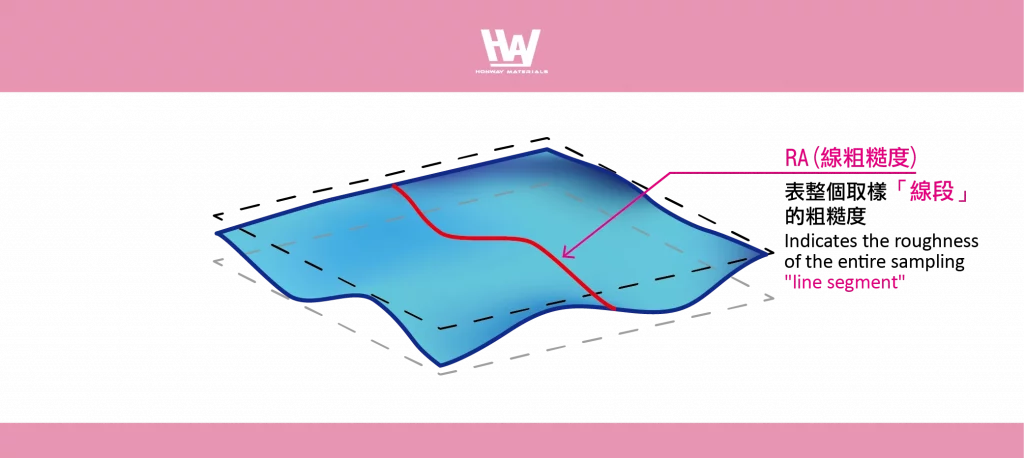
If RA works this way.
Then SA works this way.
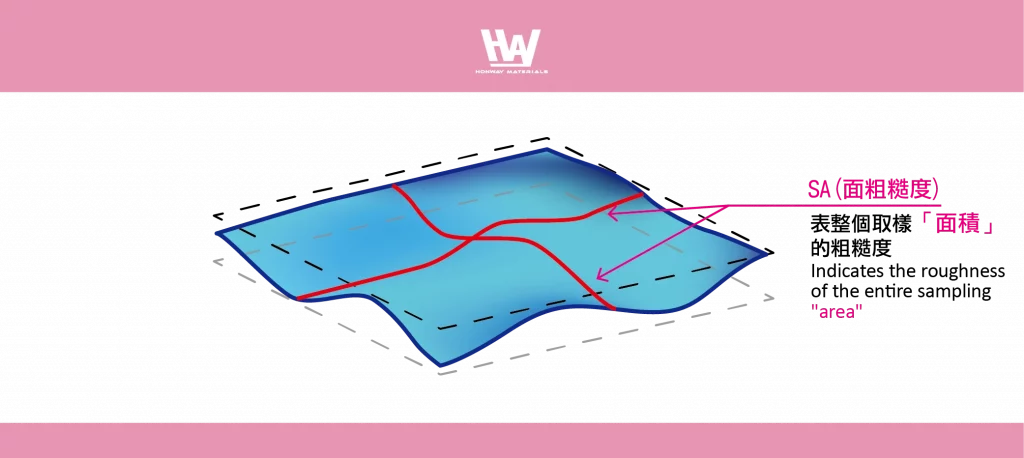
RA measures surface roughness in a one-dimensional space (a line), while SA represents the average surface roughness in a three-dimensional space (a surface).
To achieve an accurate RA value, more measurement points are required.
Although SA provides a three-dimensional assessment, RA is more commonly used in standard notations.
Definitions
When discussing surface roughness, RA (Arithmetic Average Roughness) and SA (Surface Area Roughness) represent different standards for measuring roughness. Their differences primarily lie in their definitions and calculation methods:
- RA (Arithmetic Average Roughness): This is one of the most commonly used surface roughness parameters, representing the average deviation of the surface profile. Specifically, RA is the arithmetic mean of the absolute values of the deviations from the mean line of the surface profile over a given measurement length. It is a simple and widely used indicator.
- SA (Surface Area Roughness): SA generally refers to a comprehensive indicator of surface roughness, which may consider not only roughness but also other surface characteristics such as waviness and uniformity. In practical applications, SA is sometimes used to represent three-dimensional surface roughness (as in the ISO 25178 standard). Unlike RA, it takes into account the three-dimensional contour data of the surface in its calculation.
Calculation Methods:
RA: RA is calculated by taking the average of the absolute deviations of all profile points from the mean line within the measurement range. The formula is as follows:
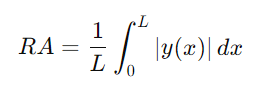
Where y(x) is the profile height and L is the measurement length.
SA: SA is typically calculated based on three-dimensional surface data. The formula for SA might look like:
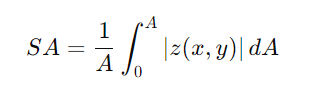
Where z(x,y) is the surface height and A is the area of the measurement region. SA takes into account the variance in surface height and other complex features.
Measurement Terminology
RA Terms and Detailed Definitions overview>>> Surface Roughness Terminology and Definitions
SA Terms
Introduction to SA parameters (the most commonly used parameters are: Sa, Sz, and Sq)
| Notation | Definitions | Descriptions | Notes | ||
| Height | Sa | Represents the average of the absolute values of the height differences at each point relative to the mean surface. | The parameter Ra extended to a surface area | One of the most widely used parameters. It represents the average height difference from the mean plane.This parameter is not affected by scratches, contamination, or measurement noise, providing stable results. | |
| Sz | The sum of the maximum peak height and the lowest valley depth. | The parameter Rz extended to a surface area: Sz = Sp + Sv. | One of the most widely used parameters. As it measures the highest peak and lowest valley, it can be affected by scratches, contamination, and measurement noise. | ||
| Sp | The maximum peak height within the measured area. | The parameter Rp extended to a surface area | |||
| Sv | The minimum valley height within the measured area. | The parameter Rv extended to a surface area | |||
| Sq | Root mean square(RMS) height | This parameter extends the profile (line roughness) parameter Rq to three dimensions. Represents the root mean square value of Z(x,y) in a defined region | One of the most widely used parameters, This parameter is unaffected by scratches, contamination, and measurement noise, providing stable results. | ||
| Ssk | Skewness | This parameter extends the profile (line roughness) parameter Rsk into three dimensions. The parameter Rsk is used to evaluate the skewness of the height distribution. Ssk = 0: Symmetrical relative to the midline. Ssk > 0: Skewed below the midline. Ssk 0: Skewed above the midline. | This parameter is related to the height distribution and is suitable for evaluating the sliding surfaces in wear and lubrication applications. | ||
| Sku | Kurtosis | This parameter extends the profile (line roughness) parameter Rku into three dimensions. The parameter Rku is used to evaluate the sharpness of the height distribution. Sku = 3: Normal distribution. Sku > 3: Sharp height distribution. Sku 3: Flat height distribution. | This parameter relates to the geometry of the peaks and valleys and is suitable for analyzing the contact between two objects. | ||
| Space | Sal | Minimum Autocorrelation Length | The shortest distance over which the autocorrelation function decays to a specified value, s (0 ≤ s 1). Unless otherwise specified, the parameter is set to s = 0.2. | These parameters replace height parameters and are used to evaluate the horizontal size and complexity of parallel grooves and particles. | |
| Str | Surface Texture Aspect Ratio | The ratio of the shortest to the longest distance over which the autocorrelation function decays to a specified value, s (0 ≤ s 1). It represents the strength of surface isotropy/anisotropy. Str values range from 0 to 1; typically, Str > 0.5 indicates strong isotropy, while Str 0.3 indicates strong anisotropy. | |||
| Mix | Sdq | Root Mean Square Gradient | This parameter extends the profile (line roughness) parameter Rdq into three dimensions. It represents the average amplitude of the local surface gradient (slope). The larger the Sdr value, the steeper the surface inclination. | ||
| Sdr | Developed Interfacial Area Ratio | The ratio of the developed surface area to the projected area within a defined region. A perfectly flat surface has an Sdr of 0. If the surface has inclinations, Sdr will increase. For example, if a flat surface is transformed into a sawtooth pattern with a 45° inclination, Sdr will become 0.414, indicating a 40% increase in surface area. | |||
| Functions | Sk | Core height | The vertical distance between the core surface and the highest peaks. | This parameter is suitable for evaluating friction and wear. It can also be used to assess the lubrication properties of engine cylinder surfaces. | |
| Spk | Peak Height Above Core Surface | The average height of peaks above the core surface. | |||
| Svk | Valley Depth Below Core Surface | The average depth of valleys below the core surface. | |||
| Smr1 | Valley Support Area | The percentage of the area where the core and peak region intersect. | |||
| Smr2 | Valley Support Area | The percentage of the area where the core and valley region intersect. | |||
| Sxp | Maximum Height of Peaks | The height difference corresponding to the support area when p and q are specified. Unless otherwise noted, the value should be taken at P = 2.5% and q = 50%. | This parameter is often used to evaluate wear and oil retention. | ||
| Vvv | Valley Void Volume | ||||
| Vvc | Core Void Volume | ||||
| Vmp | Peak Material Volume | ||||
| Vmc | Core Material Volume | ||||
| Features | Spd | Peak Density | The number of peaks per unit area. A higher value indicates more contact points with other objects. Only peaks exceeding a specified size are counted. Unless otherwise noted, the specified size is set to 5% of the maximum height, Sz. This parameter is calculated by dividing the number of peaks by the projected area. | ||
| Spc | Arithmetic Mean Curvature of Peaks | Represents the arithmetic mean value of the principal curvature (average sharpness) of the peaks. Only peaks exceeding a specified curvature are considered. A smaller value indicates that the contact points with other objects are more rounded. A larger value indicates that the contact points are sharper. Unless otherwise noted, the specified size is set to 5% of the maximum height, Sz. | This parameter is derived from the arithmetic mean of the curvature within the defined area and is suitable for analyzing the contact between two objects. | ||
| S10z | Ten-Point Height | The sum of the average of the five highest peaks and the average of the five lowest valleys. | |||
| S5p | Five-Point Peak Height | The average height of the five highest peaks. | |||
| S5v | Five-Point Valley Depth | The average depth of the five lowest valleys. | |||
| Sda | Average Valley Area | ||||
| Sha | Average Peak Area | ||||
| Sdv | Average Valley Volume | ||||
| Shv | Average Peak Volume |
When to Use SA vs. RA
- RA: Widely used for measuring the roughness of flat surfaces, such as the machined surfaces of mechanical parts. It provides a simple and effective evaluation of surface roughness.
- SA: More commonly applied in situations where three-dimensional surface features need to be considered, such as in high-precision manufacturing, optical surface treatment, and materials science. It provides more comprehensive surface roughness information.
In summary, RA is a commonly used one-dimensional roughness parameter suitable for most simple roughness measurement scenarios, whereas SA is used for more complex three-dimensional surface analysis, making it ideal for applications requiring detailed surface morphology data.
Conclusion
- SA should be adopted when managing the entire surface of an object is necessary.
- SA represents an expanded version of the RA value (as a parameter extended to a surface).
Action
- 當前測量的表面粗糙度是否達到您預期的目標 >>> 研磨拋光與表面粗糙度對照表
- Do the workpieces need to be compatible with each other?
- How to solve >>> Six mold polishing techniques: How many do you know?
- Implement >>> polishing abrasives, polishing equipment, polishing tools
- Review
After reading the content, if you still don’t know how to select the most suitable option,
Feel free to contact us and we will have specialist available to answer your questions.
If you need customized quotations, you’re also welcome to contact us.
Customer Service Hours: Monday to Friday 09:00~18:00 (GMT+8)
Phone: +8867 223 1058
If you have any topics you want to learn more about or if you find it difficult to explain over the phone, feel free to message us on Facebook.
Honway Facebook: https://www.facebook.com/honwaygroup
您可能感興趣的文章…
[wpb-random-posts]